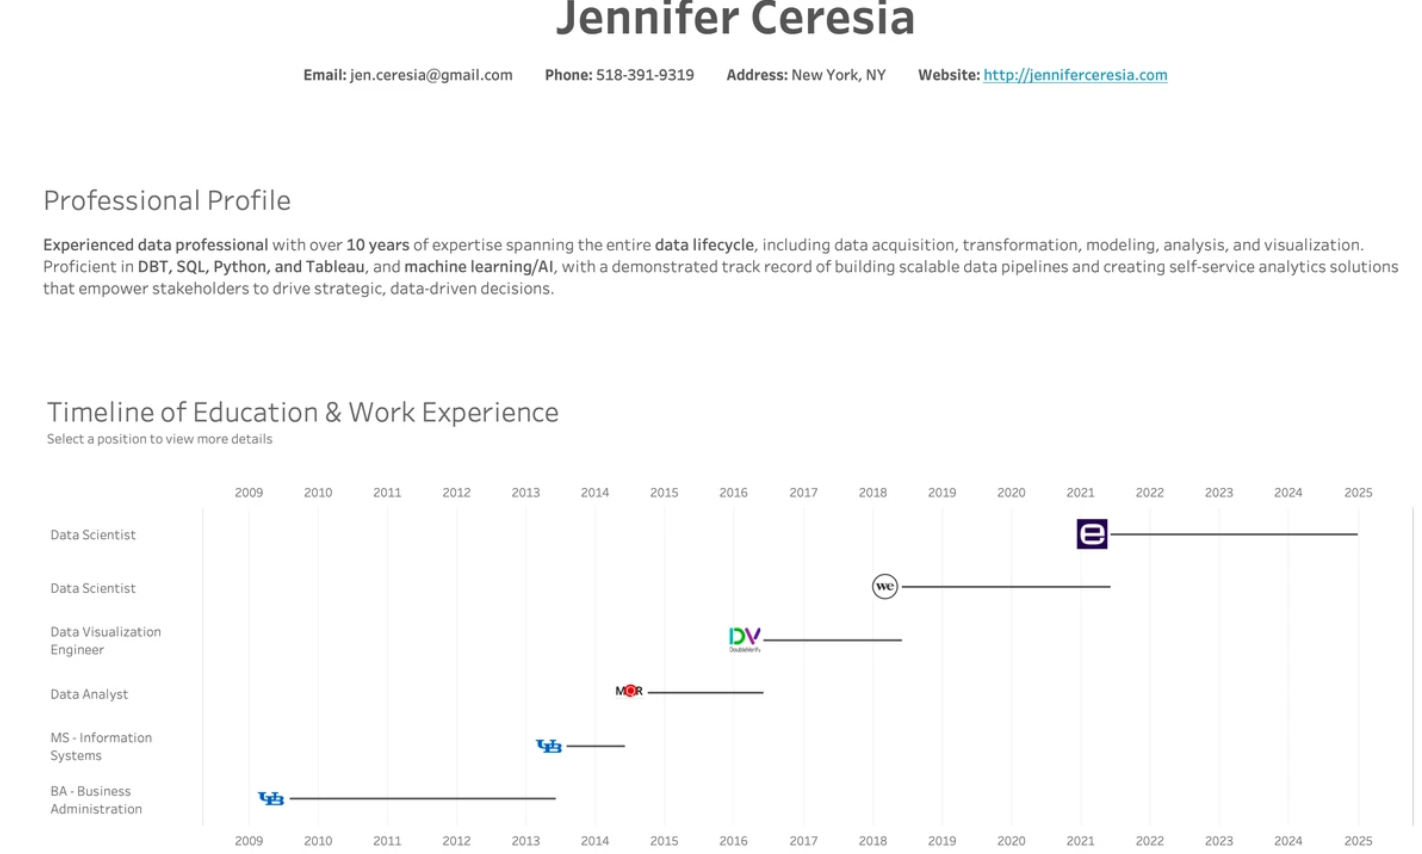
Jennifer Ceresia

Jennifer Ceresia

Senior Analytics Engineer

Senior Analytics Engineer with 10+ years of experience building scalable dbt/Snowflake ELT pipelines, dimensional models, and governed semantic layers. Expert in SQL, Python, LookML, and data quality automation. Also experienced in leveraging data analytics and visualization to help customers derive meaningful, actionable value from their data.

Data Engineering

Data Engineering

Building reliable data foundations

Data Warehousing

Data Warehousing

Designing scalable analytical platforms

Analytics Engineering

Analytics Engineering

Structuring data for trusted decision-making

Predictive & Statistical Foundations

Predictive & Statistical Foundations

Preparing data for advanced modeling and forecasting

Business Intelligence & Insights

Business Intelligence & Insights

Translating data into strategic action

Data Governance & Quality

Data Governance & Quality

Ensuring data is accurate, secure, and dependable

WORK EXPERIENCE

Data Scientist / Analytics Engineer (Hybrid)

eqtble (acquired by Paradox → later by Workday)

June 2021 – January 2026

Originally hired as part of the founding team at eqtble, which was acquired by Paradox in 2024 and later acquired by Workday in 2025.

At eqtble, I was responsible for building a new SaaS people analytics platform from the ground up. My work focused on shaping the data architecture behind the product — designing how HR, recruiting, performance, and engagement data would flow into the system, how it needed to be modeled, and how it would ultimately be visualized in dashboards customers rely on.

I owned much of the early data stack: creating the dbt project, developing our Snowflake pipelines, and building the foundations of the semantic layer that powered the product's insights. Because we were an early-stage team, I worked closely with engineering, product, and customer success not only to define what data needed to look like, but also to ensure we delivered an experience that was intuitive and genuinely valuable for our customers.

Data Scientist

WeWork

June 2018 - Present

At WeWork, I focused on designing and building Tableau dashboards that helped teams across the organization understand performance, hiring trends, and workforce health. I worked closely with HR, recruiting, and leadership teams to make sure the dashboards reflected the metrics they cared about and were easy to use in their day-to-day decision-making.

A large part of my role involved training internal teams on how to navigate dashboards, explore the data, and get meaningful insights without needing technical support. This meant partnering with stakeholders, answering questions, running walkthroughs, and helping people feel confident using data as part of their workflow.

Data Visualization Engineer

DoubleVerify

June 2016 - June 2018

At DoubleVerify, I worked on the data visualization team supporting analytics for major digital media platforms. My role centered around designing dashboards and reporting experiences that made complex advertising and media-quality data easier to understand.

I collaborated closely with analysts, product managers, and engineers to shape how performance metrics were presented to clients, ensuring that the insights we delivered were both accurate and accessible.

Data Analyst

Messina Quantitative Research

October 2014 - June 2016

At MQR, I worked as a data analyst supporting political polling and election research. I used Tableau to build dashboards that summarized polling trends, voter turnout patterns, and voter-likelihood model outputs in a way that researchers and strategists could quickly interpret.

My role involved turning large volumes of survey data into clear visual stories, helping the team understand how opinions were shifting and where different segments of the electorate were likely to engage. It was my first experience translating complex statistical information into visual insights that people could use to make decisions.

EDUCATION

University at Buffalo

MS Management Information Systems

August 2013 - June 2014

GPA: 3.8

BS Business Administration

August 2009 - June 2013

GPA: 3.9

PORTFOLIO

Click on a dashboard to open it in Tableau Public.

My Tableau Resume

NYC Subway Map

NYC Crime Analysis

GET IN TOUCH